Modern Non-Linear Modeling: Gradient Boosting & Trees
Models that find curves and interactions on their own, how to make them speak actuarial (Poisson deviance, exposure), and how SHAP makes them explain themselves.
Lesson 7 · OverviewBy the end of this lesson you can…
- Name the limits of GLMs: hand-built shapes and interactions
- Explain how CART regression trees split, and why one tree isn’t enough
- Contrast random forests (bagging) with gradient boosting
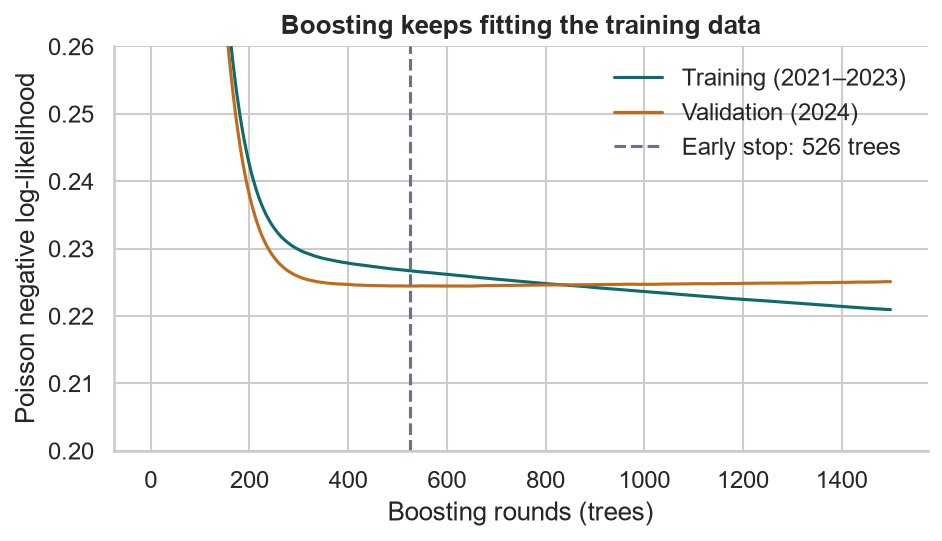
- Train XGBoost with a Poisson objective and an exposure offset, with early stopping
- Compare models fairly with grouped cross-validation and a holdout year
- Explain predictions globally and per policy with SHAP values
Companion notebook: lesson-07-gradient-boosting.ipynb — worked examples and self-checking exercises.
Where GLMs Need Help
Everything non-linear is your job.
LimitationsA GLM only knows what you tell it
- Shapes: the U in driver age needed bands (Lesson 2); mileage needed a log
- Interactions: every combination effect must be written as a term
- Search: with 20 features there are 190 pairwise interactions to consider
train["young_sports"] = ((train["driver_age"] < 25)
                         & (train["vehicle_style"] == "Sports"))
glm_i = smf.glm("n_liab ~ " + rhs + " + young_sports", ...).fit()
# young_sports IRR 1.407 (1.148–1.724)
# Sports IRR 1.728 → 1.526;  AIC 30,212.5 → 30,203.8
Lesson 2’s Sports relativity of 1.73 was inflated by an interaction we didn’t model. Once we know to add it, the GLM finds it: young driver × sports car = 1.41 (truth 1.60), and Sports falls toward its truth of 1.40.
But we knew because we built the data. In real work, which interaction should you add? Tree ensembles search for them automatically.
Trees and Ensembles
CART, random forests, gradient boosting.
CARTA regression tree for claim frequency
from sklearn.tree import DecisionTreeRegressor
cart = DecisionTreeRegressor(criterion="poisson",
                             max_depth=3, min_samples_leaf=500)
# target = claims per car-year, weighted by exposure
cart.fit(X_tr, y_tr / e_tr, sample_weight=e_tr)
|--- driver_age <= 25.2
| |--- style_Sports <= 0.5
| | |--- annual_mileage <= 13650 ...
| |--- style_Sports > 0.5 ...
|--- driver_age > 25.2
| |--- annual_mileage <= 12250 ...
| |--- annual_mileage > 12250
| | |--- urban <= 0.5 ...- Splits greedily to reduce Poisson deviance, the right loss for counts
- Interactions are built in: the Sports split only happens inside the young-driver branch
- Weighting the rate by exposure is equivalent to a Poisson offset
One tree is a step function with 8 values. It’s unstable (a small data change can flip the first split) and coarse. Holdout Gini 0.162 vs the GLM’s 0.220.
EnsemblesMany trees: bagging vs boosting
Random forest (bagging)
- Hundreds of deep, independent trees, each on a bootstrap sample and a random subset of features
- Average their predictions → variance falls
- Hard to overfit by adding trees; few settings to tune
RandomForestRegressor(n_estimators=300,
    criterion="poisson", min_samples_leaf=200,
    max_features=0.5)
Gradient boosting
- Hundreds of shallow, sequential trees; each fits what the previous ones got wrong (the gradient of the loss)
- Add each tree’s prediction, shrunk by a learning rate η → bias falls
- Can overfit: stop early on a validation set
$$F_m(\mathbf{x}) = F_{m-1}(\mathbf{x}) + \eta\, h_m(\mathbf{x})$$
Implementations: XGBoost, LightGBM, CatBoost, scikit-learn’s HistGradientBoostingRegressor.
XGBoost for Claim Frequency
A Poisson objective, an exposure offset, early stopping.
Actuarial lossesTeaching XGBoost about exposure
import xgboost as xgb

val = train["policy_year"] == 2024     # validation year
dtr = xgb.DMatrix(X[~val], label=y[~val],
                  base_margin=np.log(expo[~val]))   # offset!
dva = xgb.DMatrix(X[val], label=y[val],
                  base_margin=np.log(expo[val]))

params = {"objective": "count:poisson",   # log link
          "eta": 0.03, "max_depth": 3,
          "min_child_weight": 50,          # credibility floor
          "subsample": 0.8, "colsample_bytree": 0.8,
          "eval_metric": "poisson-nloglik"}
bst = xgb.train(params, dtr, num_boost_round=3000,
                evals=[(dtr, "train"), (dva, "valid")],
                early_stopping_rounds=100)
bst.best_iteration + 1 # 526 treescount:poisson: Poisson deviance, log link, as in the GLMbase_margin= log(exposure) is the offset- For severity:
reg:gamma; for pure premium:reg:tweediewithtweedie_variance_power - LightGBM:
objective="poisson",init_score=log exposure
Fair comparisonFive-fold cross-validation, grouped by policyholder
| Model (policy years 2021–24) | Mean Poisson deviance | vs GLM |
|---|---|---|
| GLM on raw features (linear age, raw miles) | 0.34327 | +0.00332 |
| Random forest | 0.34199 | +0.00205 |
| XGBoost (Poisson) | 0.34082 | +0.00087 |
| GLM, engineered (age bands, log miles) | 0.33994 | — |
| GLM, engineered + young × sports | 0.33989 | −0.00005 |
XGBoost beats the raw-feature GLM in all 5 folds, and loses to the engineered GLM in all 5.
This book’s true risk model is a multiplicative GLM, and a GLM with the right shapes is hard to beat. Boosting’s value was finding those shapes without being told. On real portfolios, with messier structure, boosting often wins outright.
The 2025 holdout (524 claims) is too small to separate the top models: deviance 0.19036 (XGBoost) vs 0.19047 (GLM); Gini 0.223 vs 0.220. Only the raw-feature GLM (0.19226) is clearly worse.
SHAP
Opening the black box, one prediction at a time.
TheoryShapley values: fair credit for a prediction
$$f(\mathbf{x}) = \phi_0 + \sum_{j=1}^{p}\phi_j(\mathbf{x})$$
- φ0: the average prediction (base value)
- φj: feature j’s contribution for this policy, averaged over every order in which features could be added (Shapley, 1953)
- Contributions always add up exactly to the prediction
# XGBoost computes exact TreeSHAP itself.
# base_margin = 0 → explain the log ANNUAL claim rate
d = xgb.DMatrix(X_hold, base_margin=np.zeros(len(X_hold)))
phi = bst.predict(d, pred_contribs=True)   # last col = φ0
phi[0, -1]            # −2.756 → e^−2.756 = 0.0636 per year
With a log link, SHAP values live on the log scale, so eφj is a multiplicative relativity for this one policy. It’s a per-policy rating factor.
The shap package draws the plots: wrap XGBoost’s values in shap.Explanation(values, base_values, data, feature_names), then call shap.plots.beeswarm or shap.plots.waterfall.
GlobalWhat drives the model, and which way
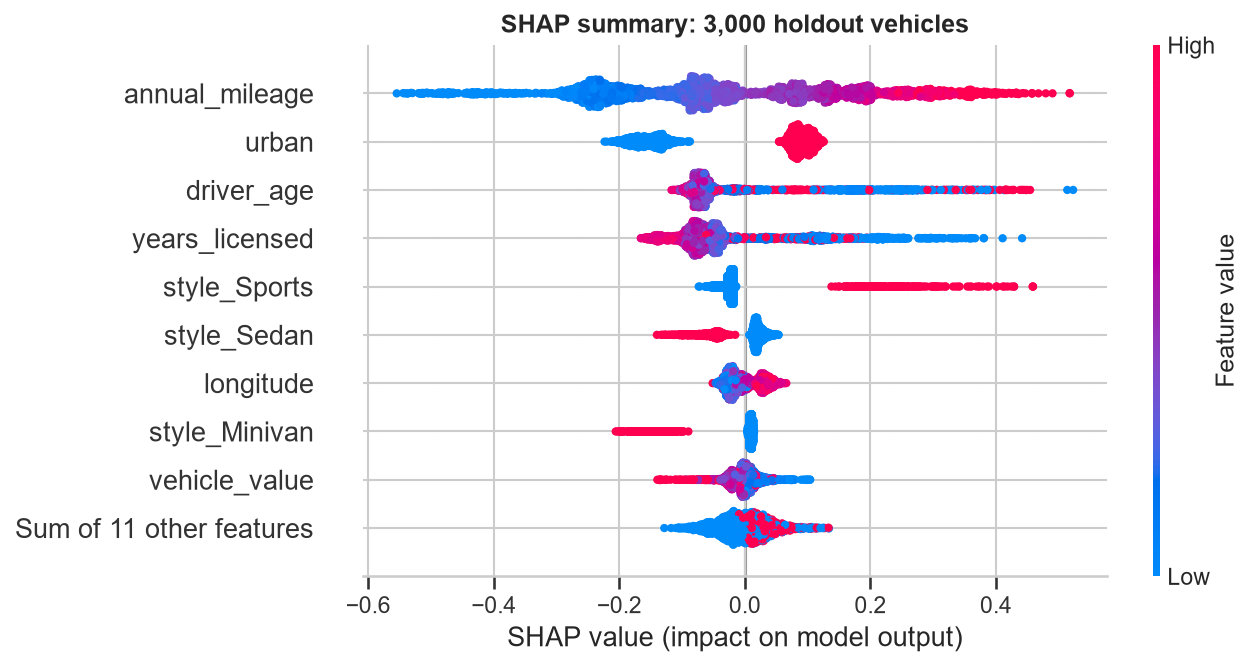
| Feature | Mean |φ| |
|---|---|
| annual_mileage | 0.171 |
| urban | 0.116 |
| driver_age | 0.090 |
| years_licensed | 0.087 |
| style_Sports | 0.039 |
One dot per vehicle; color = feature value. Gender and channel: ≤ 0.004.
Age and years licensed carry the same information, so the model splits the credit between them.
ShapesThe model found the curves on its own
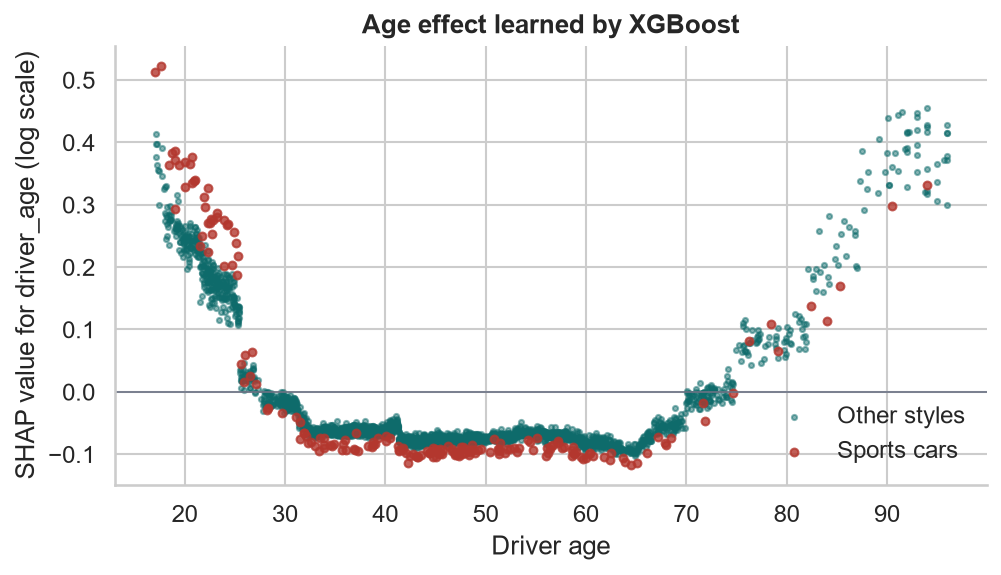
The U in age, with no bands. Young sports-car drivers (red) sit highest.
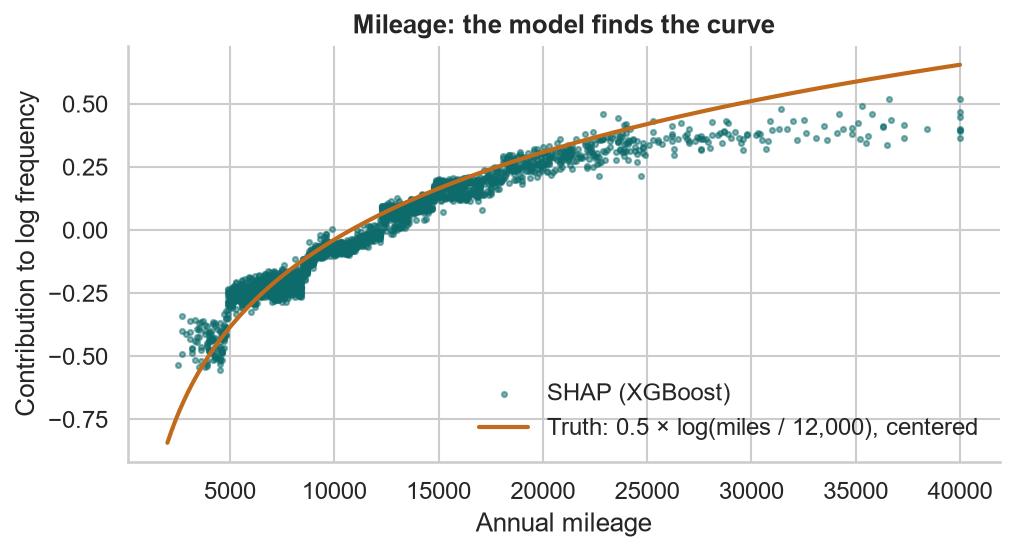
Mileage follows the true 0.5 × log(miles) curve, flattening where data runs out above 25,000.
LocalWhy is this driver’s rate high?
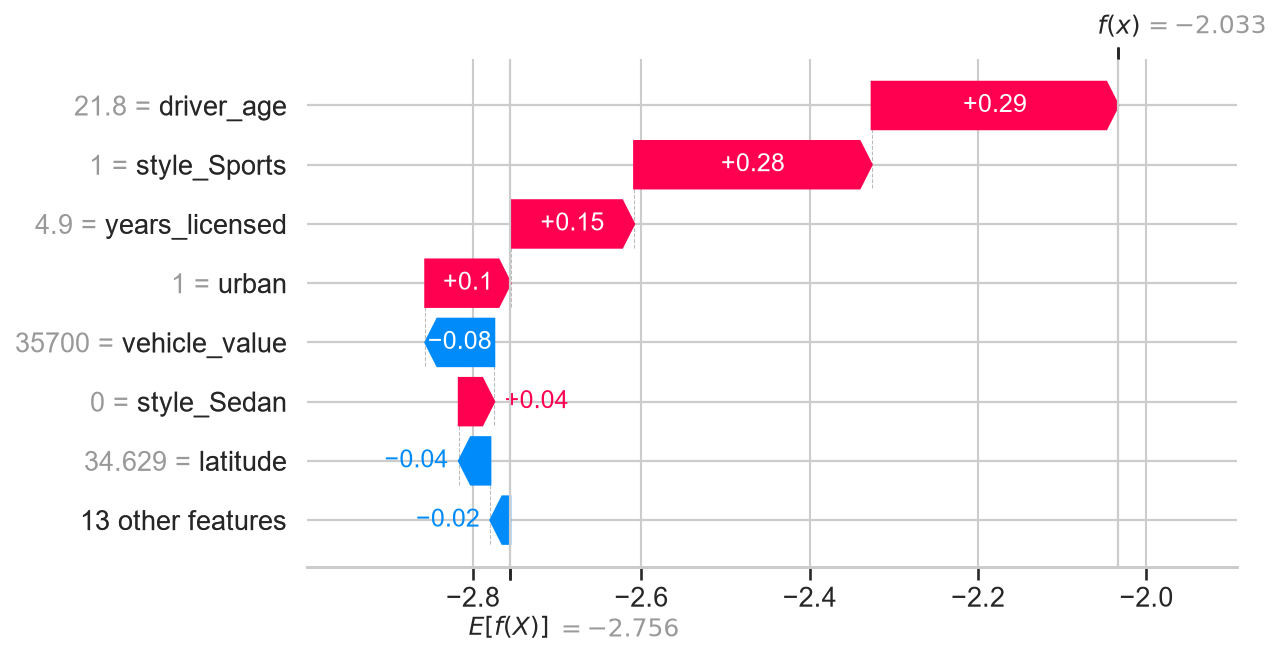
A 21.8-year-old, urban, sports car, 12,200 miles:
| Base φ0 | −2.756 | 0.0636 |
| driver_age | +0.293 | × 1.34 |
| style_Sports | +0.282 | × 1.33 |
| years_licensed | +0.147 | × 1.16 |
| urban | +0.101 | × 1.11 |
| vehicle_value | −0.082 | × 0.92 |
| Prediction | −2.033 | 0.131 per year |
Smaller contributions from other features make up the rest.
InteractionsSHAP interaction values: a lead, not a verdict
inter = bst.predict(d, pred_interactions=True)
# inter[i, j, k]: policy i's joint effect of features j and k| Pair (mean |interaction|) | Value | In the truth? |
|---|---|---|
| annual_mileage × urban | 0.028 | No |
| driver_age × style_Sports | 0.011 | Yes |
| annual_mileage × style_Sedan | 0.010 | No |
For young sports-car drivers, the age and license × Sports interactions add +0.221: × 1.25 (truth × 1.60).
The top-ranked “interaction” isn’t real: the model is approximating a smooth multiplicative surface with step functions, and that leaves interaction-shaped residue.
The professional workflow: use boosting + SHAP to find candidate shapes and interactions, then test them in the GLM with likelihood-ratio tests and holdout data. The GLM stays the filed, explainable rating plan.
Actuarial Lab · 75 minXGBoost claim frequency with SHAP
- Build a numeric feature matrix: one-hot style and channel, 0/1 urban and male
- Train XGBoost (
count:poisson,base_margin= log exposure) on 2021–23, early-stopping on 2024 - Refit on 2021–24 with the chosen number of trees
- Five-fold GroupKFold: raw GLM, engineered GLM, XGBoost
- SHAP: beeswarm, age and mileage dependence, one waterfall
- Find the strongest interactions; test young × sports in the GLM with an LR test
Answer key
| Early-stopped trees | 526 |
| CV deviance: raw GLM · XGB · GLM | 0.3433 · 0.3408 · 0.3399 |
| SHAP base rate | 0.0636 |
| Top feature by mean |φ| | annual_mileage |
| young_sports IRR in the GLM | 1.407 |
| AIC with the interaction | 30,203.8 |
RecapLesson 7 checklist
- I know what a GLM can’t find on its own
- I can explain CART, bagging, and boosting
- I train XGBoost with a Poisson objective and a log-exposure offset
- I stop boosting early on a validation year
- I compare models with grouped CV, not a single lucky split
- I read SHAP values as per-policy log relativities
- I treat interaction rankings as leads to test, not facts
- I use boosting to improve the GLM, not only to replace it
Production Pipelines & Model Comparison
scikit-learn Pipelines, penalized GLMs, persisting models with joblib, and an A/B test on holdout loss ratios.