Interactive Dashboards with Streamlit
From static Excel reports to a live application: the Executive Underwriting Portal, where pricing actuaries move rating factors and see the portfolio respond.
Lesson 5 · OverviewBy the end of this lesson you can…
- Explain Streamlit’s model: the script reruns on every interaction
- Separate the numbers (pure, tested functions) from the page that shows them
- Lay out a page with a sidebar, columns, tabs, metrics, and charts
- Cache data and models, and keep state across reruns with
st.session_state - Accept a file upload, validate it, and price it through the API
- Test an app headlessly with
AppTest
Companion notebook: lesson-05-dashboards.ipynb — worked examples and self-checking exercises.
WhyWhat the rate review spreadsheet can’t do
| Spreadsheet | Portal |
|---|---|
| A copy of the book, as of last month | The book in the database, now |
| Expected losses pasted in from a model run | Computed by the champion model the API serves |
| One scenario per tab, emailed around | Move a slider; compare saved scenarios |
| “Which version is right?” | One URL, one source of truth |
The people who decide rate changes (chief actuary, underwriting, finance) want to ask “what if urban goes up 20% instead of 25%?” and see the answer while they are still in the meeting.
Excel stays excellent for ad-hoc analysis and for exhibits (Course 1, Lesson 7). A portal is for questions that are asked again and again, against live data.
The Numbers
Pure functions first; the page is a thin layer.
portfolio.pyReprice the book, no UI involved
@dataclass(frozen=True)
class Adjustments:
    base_change: float = 0.0
    urban_factor: float = 1.0
    non_urban_factor: float = 1.0
    young_factor: float = 1.0      # drivers under 25
    sports_factor: float = 1.0
    cap: float | None = None       # e.g. 0.25
    expense_ratio: float = 0.25

def reprice(book, adj):
    b = book
    factor = ((1 + adj.base_change)
        * np.where(b.urban, adj.urban_factor,
                   adj.non_urban_factor)
        * np.where(b.driver_age < 25, adj.young_factor, 1)
        * np.where(b.vehicle_style == "Sports",
                   adj.sports_factor, 1))
    if adj.cap is not None:
        factor = np.clip(factor, 1 - adj.cap, 1 + adj.cap)
    out = b.assign(proposed_liab=(b.liab_premium * factor).round(2))
    out["change"] = out.proposed_liab / out.liab_premium - 1
return outsummary(): premium, projected loss ratio (expected loss ÷ premium), margin (1 − loss ratio − expenses), and how many customers move more than 15%by_segment(): the same by urban, style, or age band- Expected losses: the champion GLM’s pure premium per vehicle, trended 1.5 years at 4%, stored with the book
These are ordinary functions on a DataFrame: unit-tested (no change means no change; the cap holds; margin arithmetic) and reusable in a notebook, a report, or the API.
The book today18,249 vehicles, $19.88m of liability premium
| Segment | Vehicles | Loss ratio |
|---|---|---|
| Non-urban | 7,347 | 58.2% |
| Urban | 10,902 | 90.8% |
| Sports cars | 1,238 | 103.1% |
| Drivers 17–20 | 655 | 99.2% |
| Book | 18,249 | 77.7% |
Projected loss ratio: expected losses $15.45m ÷ current premium. Target 68%. With 25% expenses the margin is −2.7%.
The same story as the Course 3 rate review (overall indication +14.3%): the manual has no urban factor, so urban drivers are subsidized by everyone else.
The proposal from that review: urban × 1.25 (the indication, capped at +25%), non-urban × 0.857.
Streamlit
A Python script that becomes a web page.
The modelThe whole script reruns on every interaction
import streamlit as st

st.title("Executive Underwriting Portal")

with st.sidebar:
    urban = st.slider("Urban factor", 0.70, 1.50,
                      step=0.01, key="urban_factor")
    ...

priced = reprice(book(), Adjustments(urban_factor=urban, ...))
s = summary(priced)

c1, c2, c3, c4 = st.columns(4)
c1.metric("Liability premium",
          f"${s['proposed_premium'] / 1e6:,.2f}m",
          f"{s['premium_change']:+.1%}")
c2.metric("Projected loss ratio", ...)- No callbacks to wire up: widgets are function calls that return their current value
- Rerunning everything is cheap only if the expensive parts are cached
Caching & stateWhat survives a rerun
@st.cache_resource            # one per process: connections, models
def database():
    return db.make_engine(settings.sqlalchemy_url())

@st.cache_data(ttl=600)       # a copy per call: data frames
def book() -> pd.DataFrame:
    return db.read_book(database())

# session_state: this user's memory across reruns
st.session_state.setdefault("scenarios", [])
if st.button("Save this scenario", key="save"):
    st.session_state["scenarios"].append({...})

# a link can choose the starting point: ?preset=...
wanted = st.query_params.get("preset", "Current rates")| Tool | Holds | Shared by |
|---|---|---|
cache_resource | engine, model | all users |
cache_data | the book, 10 min | all users (copied) |
session_state | saved scenarios | one browser tab |
query_params | the preset | anyone with the link |
Never mutate a cache_data result in place, and never put one user’s data in cache_resource: every other user would see it.
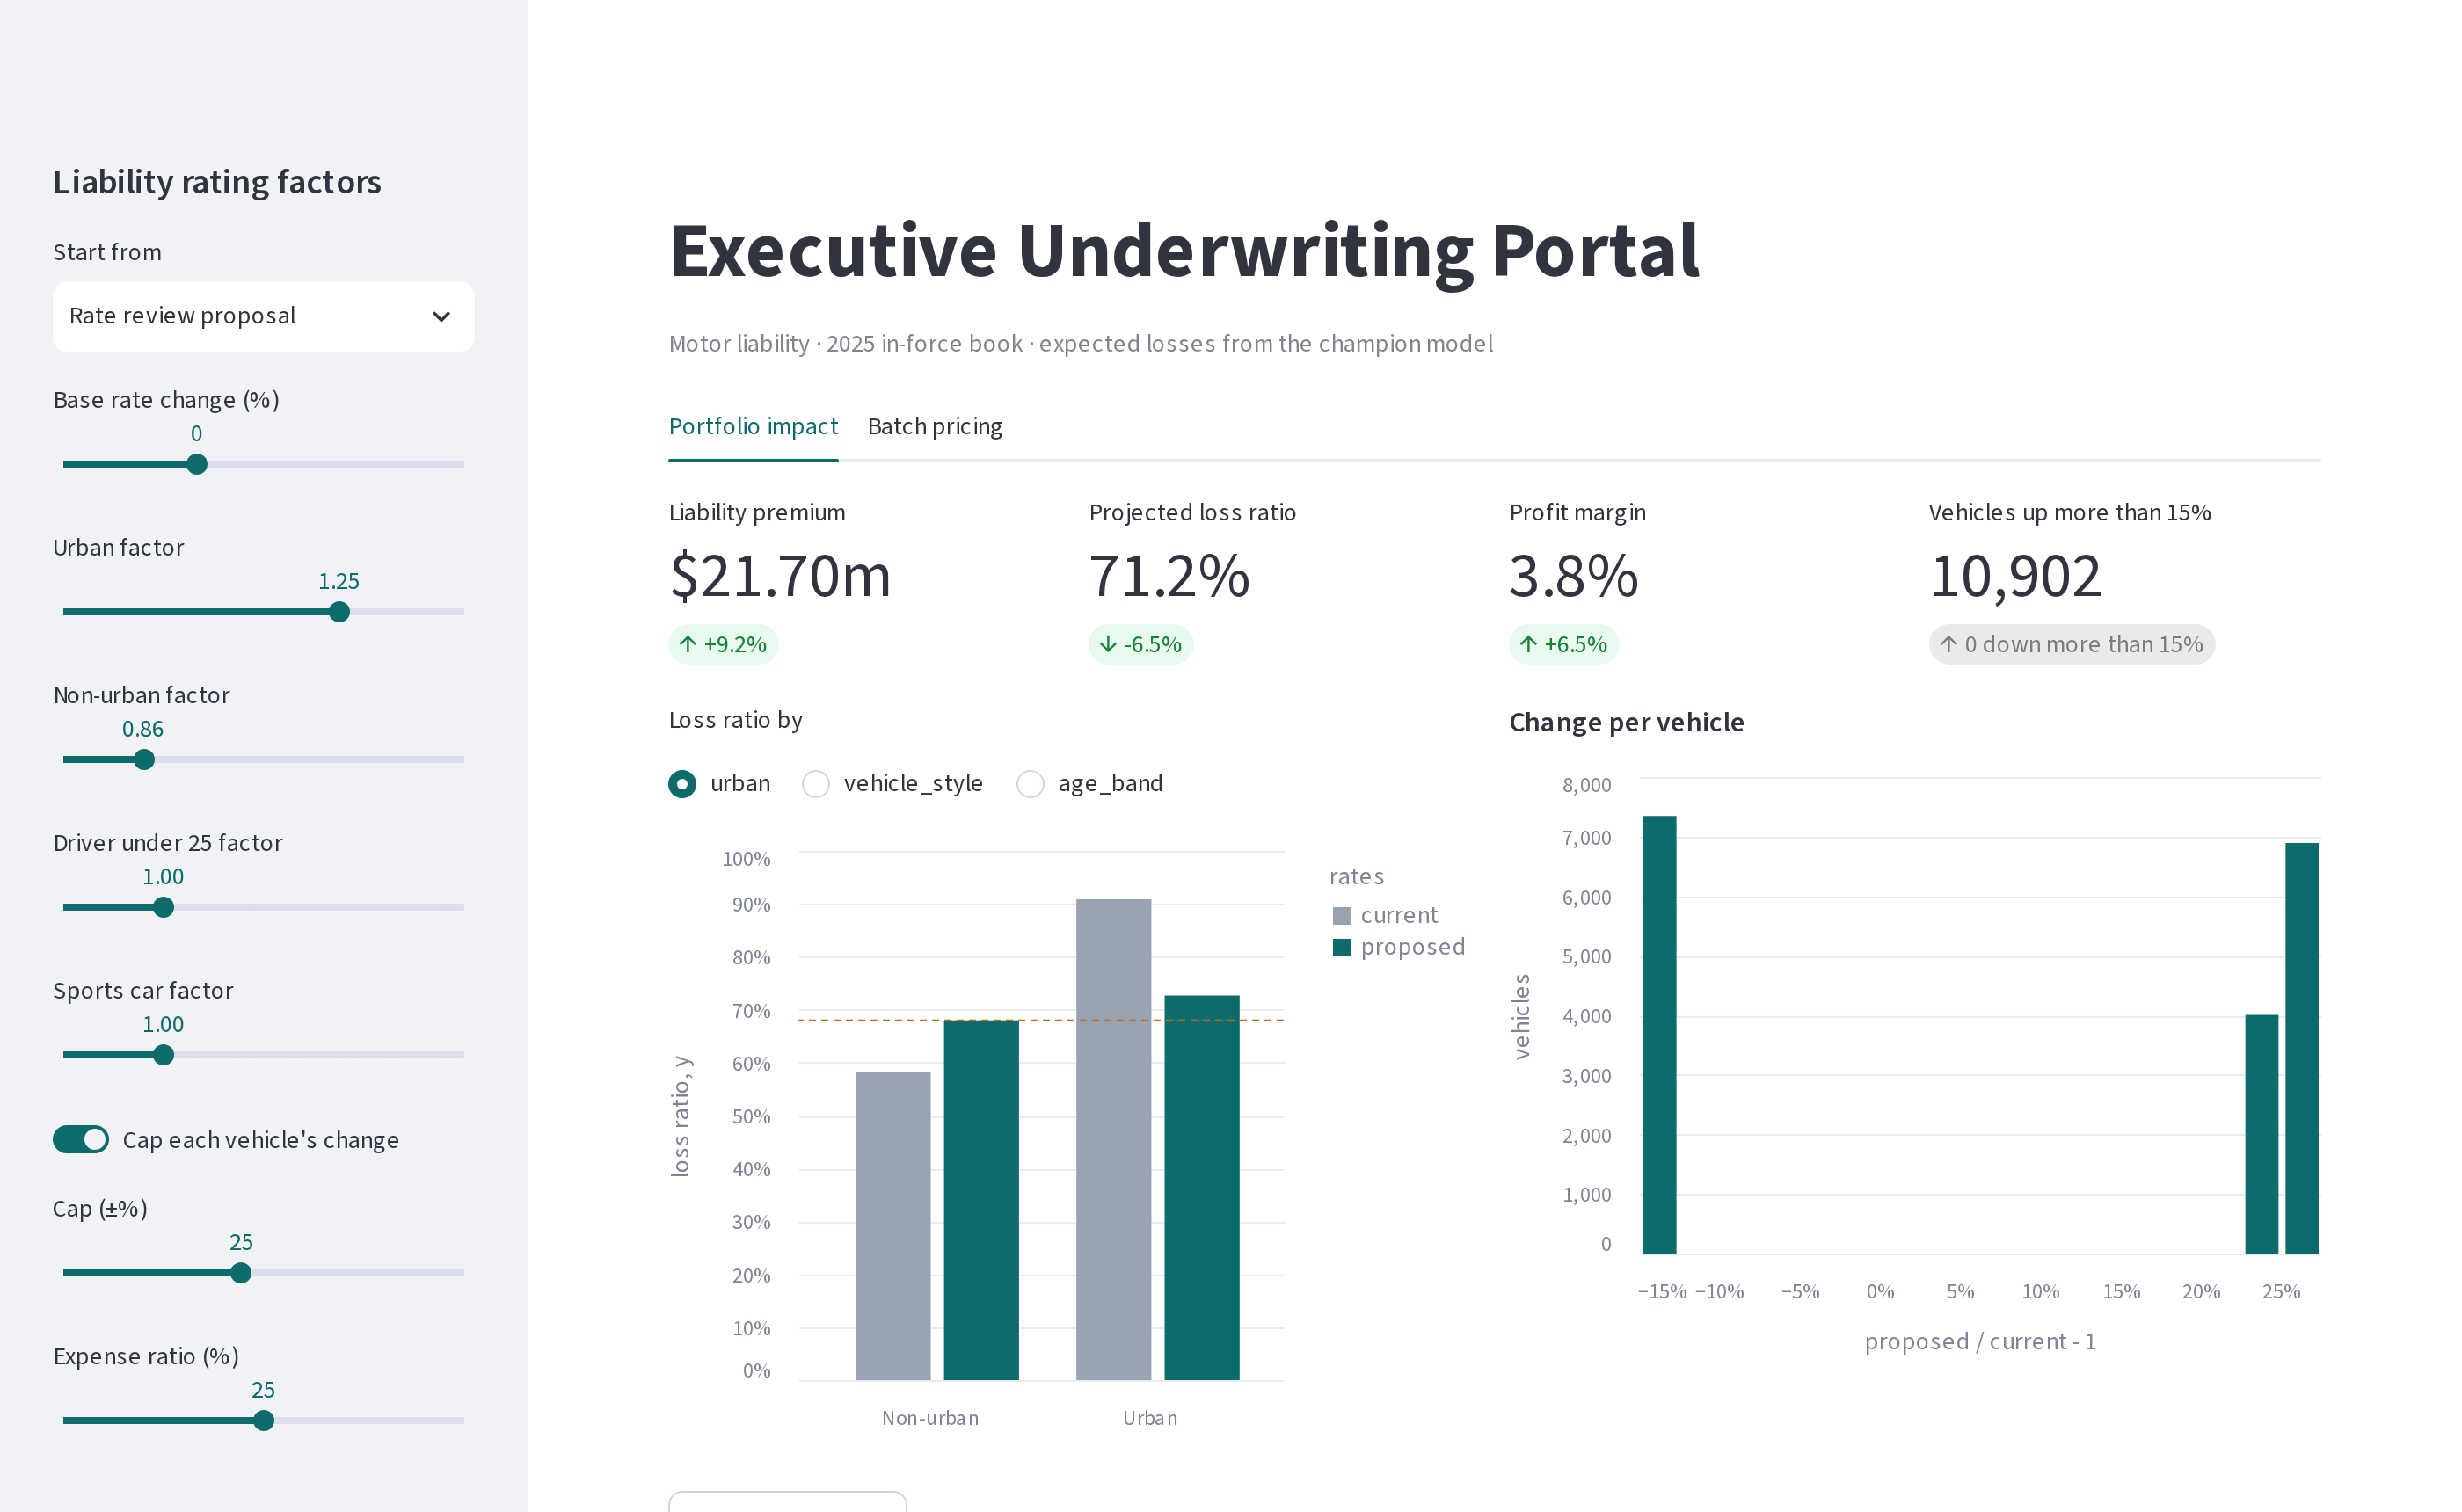
The portalThe rate review proposal, live
Reading itWhat the proposal does to the book
| Current | Proposal | |
|---|---|---|
| Liability premium | $19.88m | $21.70m (+9.2%) |
| Projected loss ratio | 77.7% | 71.2% |
| Margin (25% expenses) | −2.7% | +3.8% |
| Urban loss ratio | 90.8% | 72.7% |
| Non-urban loss ratio | 58.2% | 68.0% |
| Sports loss ratio | 103.1% | 95.1% |
| Vehicles up more than 15% | 0 | 10,902 |
- Every urban customer’s liability premium rises 25%: that is the dislocation the business must decide to accept
- Non-urban lands exactly on target; urban is still above it because of the cap
- Sports cars stay far above target. Adding Sports × 1.10 and under-25 × 1.10 takes the book to 70.6% and a 4.4% margin
The portal doesn’t make the decision. It makes the trade-off between adequacy and customer disruption visible while the people who own the decision are looking at it.
Batch pricingUpload a file, validate it, price it through the API
upload = st.file_uploader("Quote requests (CSV)", type="csv")
if upload is not None:
    raw = pd.read_csv(upload, dtype=str, keep_default_na=False)
    good, bad = [], []
    for row in raw.to_dict(orient="records"):
        try:
            good.append(QuoteRequest.model_validate(...))
        except ValidationError as exc:
            bad.append({"quote_id": ..., "problem": ...})
    st.dataframe(pd.DataFrame(bad))
    if settings.api_url:                  # in production
        quotes = RatingClient(settings.api_url, key) \
                     .quote_batch([r.model_dump(mode="json")
                                   for _, r in good])
    ...
    st.download_button("Download priced quotes",
                       csv_text, "priced_quotes.csv")
The 1,000 new-business requests: 963 priced, 37 listed with the reason, before anything is sent to the API.
- The portal doesn’t rate anything itself: it calls the same API as every other channel, so a quote from the portal equals a quote from the website
- Without
RP_API_URL(a laptop), it falls back to rating locally with the same engine
TestingAppTest: the app without a browser
from streamlit.testing.v1 import AppTest

def test_moving_a_slider_reprices_the_book(app):
    app.slider(key="urban_factor").set_value(1.25).run()
    assert metric(app, "Liability premium").delta.startswith("+")
    assert metric(app, "Projected loss ratio").delta.startswith("-")

def test_preset_and_saved_scenarios(app):
    app.selectbox(key="preset").set_value(
        "Rate review proposal").run()
    assert app.slider(key="urban_factor").value == 1.25
    app.button(key="save").click().run()
    app.slider(key="base_change").set_value(5).run()
    app.button(key="save").click().run()
    assert len(app.session_state["scenarios"]) == 2

def test_a_link_can_choose_the_preset(...):
    at.query_params["preset"] = "Rate review proposal"
...AppTest.from_file(path).run()executes the script as Streamlit would- Find widgets by
key, set values, click, rerun, then read metrics, tables, and state - 4 portal tests run in under two seconds against a temporary SQLite book
Give every widget a key: tests (and presets) can then address it by name.
Actuarial Lab · 75 minThe Executive Underwriting Portal
- Score the 2025 book with the champion model: expected annual liability loss
- Write and test
reprice,summary,by_segment - A sidebar with base change, urban, non-urban, under-25, Sports, cap, expenses
- Four metrics, a loss-ratio chart by segment, a histogram of changes
- Presets, saved scenarios in
session_state, a?preset=link - A batch tab: upload, validate, price, download
- AppTest tests for sliders, presets, and saving
Answer key
| Current projected loss ratio | 77.7% |
| Proposal: premium change | +9.2% |
| … loss ratio / margin | 71.2% / 3.8% |
| … vehicles up > 15% | 10,902 |
| Worst style after proposal | Sports, 95.1% |
RecapLesson 5 checklist
- The numbers are pure functions with their own tests
- The page is a thin layer that calls them
- Expensive things are cached, correctly scoped
- Per-user memory lives in
session_state
- Uploads are validated before anything is priced
- The portal prices through the same API as everyone else
- The trade-off between adequacy and disruption is on screen
- AppTest checks the app without a browser
Enterprise Data Stores: SQL & SQLAlchemy
Migrating the CSV pipeline to a relational database: keys, constraints, transactions, chunked queries, and the ORM, on SQLite and PostgreSQL.