Programmatic Spatial Data Analysis
GeoPackages, coordinate reference systems, and spatial joins — rating territories and coastal risk, without leaving Python.
Lesson 6 · OverviewBy the end of this lesson you can…
- Read shapefiles and GeoPackages into a
GeoDataFrame - Explain coordinate reference systems and choose one fit for measuring distance
- Turn latitude/longitude columns into points, and reproject them
- Assign policies to territories with
gpd.sjoin— and handle the misses - Build geographic risk proxies: urban density and distance to the coast
- Map rating results as a credibility-aware choropleth
Companion notebook: lesson-06-spatial-analysis.ipynb — worked examples and self-checking exercises.
WhyReplacing the desktop GIS
Territory work has traditionally meant exporting a CSV, opening QGIS, clicking through a spatial join, exporting again, and re-importing into Excel.
- Not repeatable — next quarter, click it all again
- Not reviewable — no record of which layer or setting was used
- Not connected to the pricing data pipeline
geopandas is pandas with a geometry column. Everything from Lessons 1–5 still works; spatial operations are added on top.
Our data: real North Carolina geography — 100 counties and 777 incorporated places (US Census 2023), and the coastline (Natural Earth) — with 23,993 synthetic insured vehicles.
Geospatial Data
File formats, geometries, and the GeoDataFrame.
FormatsShapefiles and GeoPackages
| Shapefile | GeoPackage | |
|---|---|---|
| Files | 4+ (.shp, .shx, .dbf, .prj…) that must travel together | one .gpkg |
| Layers | one per file set | many in one file |
| Column names | max 10 characters | unlimited |
| Standard | 1990s de facto | open OGC standard (SQLite) |
Census boundaries still ship as zipped shapefiles — gpd.read_file("x.zip") reads them directly. Save your working data as GeoPackage.
import geopandas as gpd
import pyogrio

pyogrio.list_layers("data/geo/nc_geo.gpkg")
# [['counties'  'Polygon']
#  ['places'    'MultiPolygon']
#  ['coastline' 'LineString']]

counties = gpd.read_file("data/geo/nc_geo.gpkg",
                         layer="counties")
counties.head(3)
#   county_fips county_name  geometry
# 0       37095        Hyde  POLYGON ((…))
# 1       37113       Macon  POLYGON ((…))
# 2 37069 Franklin POLYGON ((…))GeoDataFrameA DataFrame with a geometry column
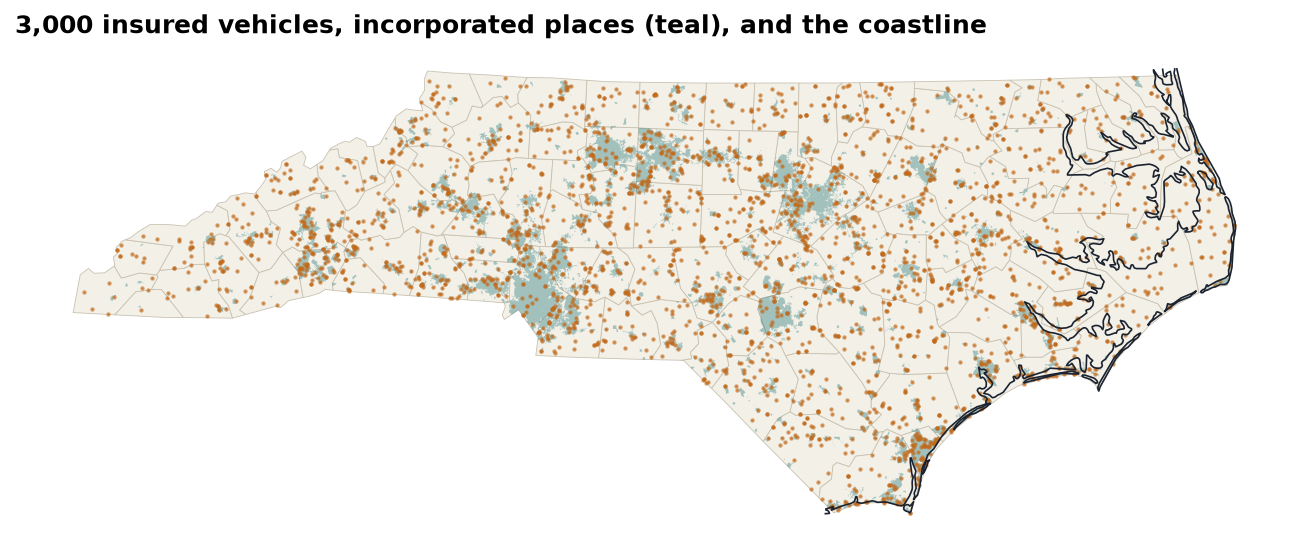
Points
Vehicles’ garaging locationsLines
The coastline — 12 piecesPolygons
Counties; places (multi-part)Each layer draws with .plot(ax=ax) — stack them on one axes to build a map.
Coordinate Reference Systems
Numbers only mean a place once you say which system they’re in.
CRSDegrees, meters, and EPSG codes
| EPSG | Name | Units | Use for |
|---|---|---|---|
4326 | WGS 84 | degrees | storing lat/long, GPS |
3857 | Web Mercator | “meters” | web map tiles only |
32119 | NAD83 / North Carolina | meters | distances & areas in NC |
counties.crs          # EPSG:32119
pts.to_crs(counties.crs)          # reproject (pyproj)
pts.set_crs("EPSG:4326")          # LABEL only — no math
Raleigh → Wilmington, measured four ways:
| In EPSG:4326 (degrees) | 1.7016 “units” |
| In EPSG:3857 (Web Mercator) | 224.86 km |
| In EPSG:32119 (state plane) | 183.63 km |
Geodesic on the ellipsoid (pyproj.Geod) | 183.65 km |
Web Mercator stretches distances by 1/cos(latitude) — here 22% too long. Measure in a local projected CRS, never in degrees or Web Mercator.
PointsFrom latitude/longitude columns to geometry
abt = pd.read_parquet("data/processed/abt.parquet")

pts = gpd.GeoDataFrame(
    abt,
    geometry=gpd.points_from_xy(abt["longitude"],   # x first!
                                abt["latitude"]),   # then y
    crs="EPSG:4326",                  # what the numbers ARE
).to_crs("EPSG:32119")                # what we want to measure in
points_from_xy(x, y): longitude is x, latitude is y. Swap them and North Carolina lands in Antarcticacrs=declares the system the raw numbers are in.to_crs()transforms coordinates;.set_crs()only relabels- Bring every layer into the same CRS before combining them
Sanity check: pts.total_bounds should sit inside counties.total_bounds. Plot them together — a misplaced CRS is obvious on a map.
Spatial Joins
Merging on where instead of on a key.
sjoinWhich county is each vehicle in?
j = gpd.sjoin(pts,
              counties[["county_fips", "county_name", "geometry"]],
              how="left", predicate="within")

len(j)                          # 23993 — no duplicates
j["county_fips"].isna().sum()   # 12 — unmatched!
j = j.drop(columns="index_right")
Why 12 misses? The county file is generalized (the 1:20m version) — smoothed coastlines cut off a few waterfront addresses. gpd.sjoin_nearest(misses, counties, max_distance=2_000) assigns all 12; the furthest is 767 m away.
predicate= | Keeps pairs where the left geometry… |
|---|---|
within | lies inside the right |
intersects | touches or overlaps it |
contains | encloses it |
Same discipline as Lesson 3: check the row count (a point in two overlapping polygons appears twice) and the unmatched count. sjoin_nearest with a max_distance rescues near-misses without inventing far-away matches.
Urban densityInside a town or not?
places = gpd.read_file("data/geo/nc_geo.gpkg", layer="places")

u = gpd.sjoin(j[["vehicle_id", "geometry"]],
              places[["place_name", "geometry"]],
              how="left", predicate="within")
u["vehicle_id"].duplicated().sum()     # 0
j["urban"] = u.set_index("vehicle_id") \
              .loc[j["vehicle_id"], "place_name"].notna().to_numpy()

j["urban"].mean() # 0.5943| Rural | Urban | Ratio | |
|---|---|---|---|
| COLL frequency | 0.0769 | 0.0953 | 1.24× |
| COLL loss ratio | 84.7% | 103.1% | |
| LIAB frequency | 0.0552 | 0.0713 | 1.29× |
| LIAB loss ratio | 59.0% | 71.6% |
More traffic, more collisions. The rating plan charges town and country alike, so urban risks run ~20 loss-ratio points worse. Incorporated place boundaries are a crude density proxy; census urban-area or population-density layers are better.
Geographic Risk Proxies
Distances, buffers, and territory schemes.
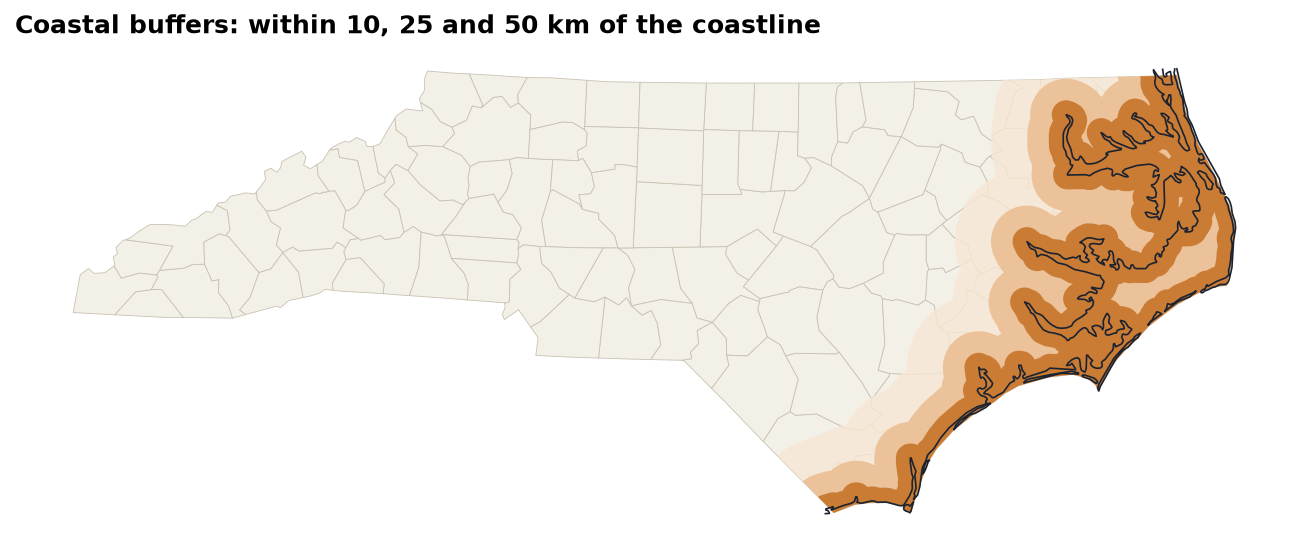
ProximityDistance to the coastline
coast = gpd.read_file("data/geo/nc_geo.gpkg", layer="coastline")
coastline = coast.union_all()        # one geometry

j["coast_km"] = j.geometry.distance(coastline) / 1000
j["coast_band"] = pd.cut(j["coast_km"],
    [0, 10, 25, 50, 100, 1000], right=False,
labels=["<10 km", "10–25", "25–50", "50–100", "100+"])| Band | COMP exposure | COMP freq. | COMP LR |
|---|---|---|---|
| <10 km | 2,431 | 0.0650 | 194.8% |
| 10–25 | 964 | 0.0633 | 188.3% |
| 25–50 | 1,027 | 0.0506 | 202.7% |
| 50–100 | 1,720 | 0.0250 | 87.6% |
| 100+ | 10,844 | 0.0276 | 85.0% |
MappingA credibility-aware choropleth
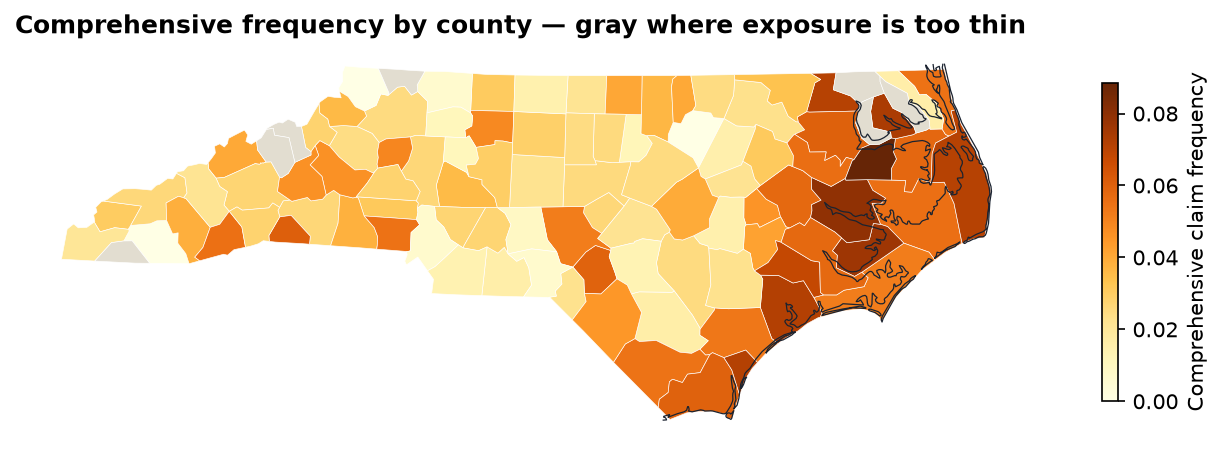
m = counties.merge(county_comp, on="county_fips", validate="one_to_one")
m.loc[m["exposure"] < 60, "frequency"] = np.nan    # too thin to show
m.plot(column="frequency", cmap="YlOrBr", legend=True,
       missing_kwds={"color": "#e2ddd0"})
Lesson 4’s puzzle solved: the Mountains’ high comprehensive loss ratio isn’t coastal — all 3,768 mountain car years are 100+ km from the sea. It’s a handful of noisy mountain counties. The coastal effect, by contrast, is consistent and large.
TerritoriesFrom proxies to a rating territory
j["territory"] = np.select(
    [j["coast_km"] < 25, j["urban"]],
    ["Coastal", "Urban inland"],
    default="Rural inland")

portfolio_pp = j["incurred"].sum() / j["exposure"].sum()
t = j.groupby("territory").agg(
        exposure=("exposure", "sum"), claims=("n_claims", "sum"),
        incurred=("incurred", "sum"), premium=("earned_premium", "sum"))
t["pure_premium"] = t["incurred"] / t["exposure"]
t["relativity"] = t["pure_premium"] / portfolio_pp
t["loss_ratio"] = t["incurred"] / t["premium"]| Territory | Exposure | Freq. | Pure prem. | Relativity | LR |
|---|---|---|---|---|---|
| Coastal | 4,070 | 0.1907 | 1,317 | 1.073 | 80.5% |
| Urban inland | 9,747 | 0.1716 | 1,293 | 1.053 | 78.3% |
| Rural inland | 6,284 | 0.1440 | 1,067 | 0.870 | 64.9% |
np.select takes the first true condition — so a town on the coast counts as Coastal. Order the conditions by priority, and document it.
The flat 1.15 territory load in today’s rates overcharges rural drivers and undercharges everyone else.
Actuarial Lab · 75 minTerritory rating factors, in code
- Read the three layers; confirm they share EPSG:32119
- Build vehicle points from the ABT; reproject
sjointo counties; rescue the 12 misses withsjoin_nearestsjointo places →urbanflag (59.4%)- Distance to coast →
coast_kmandcoast_band - Coverage-level metrics by
urbanand bycoast_band - Three-territory scheme with relativities
- Save the enriched ABT as a GeoPackage layer and a Parquet file
Answer key
| Vehicles | 23,993 |
Unmatched after within | 12 |
| Urban share | 59.43% |
| Median distance to coast | 164.9 km |
| COMP freq. <10 km vs. 100+ | 0.0650 vs. 0.0276 |
| Coastal relativity | 1.073 |
The same pattern works for any boundary layer: US Census tracts or ZIP code tabulation areas (TIGER/Line), UK postcode sectors or LSOAs (ONS Open Geography). Only the file changes.
RecapLesson 6 checklist
- I can read shapefiles and GeoPackages, and list a GeoPackage’s layers
- I know EPSG:4326 from a projected CRS, and
to_crsfromset_crs - I build points with longitude as x
- I measure distances only in a projected CRS
- I check row and unmatched counts after every
sjoin - I built urban and coastal risk proxies
- I mask thin cells on a choropleth
- I derived territory relativities: 1.073 / 1.053 / 0.870
Automated Excel Engineering with openpyxl
Styled, formula-driven workbooks built by code — including an interactive underwriting panel.